Mathematik für Physikstudierende C
Inhalt
Mathematik für Physikstudierende C
import numpy as np
import matplotlib.pyplot as plt
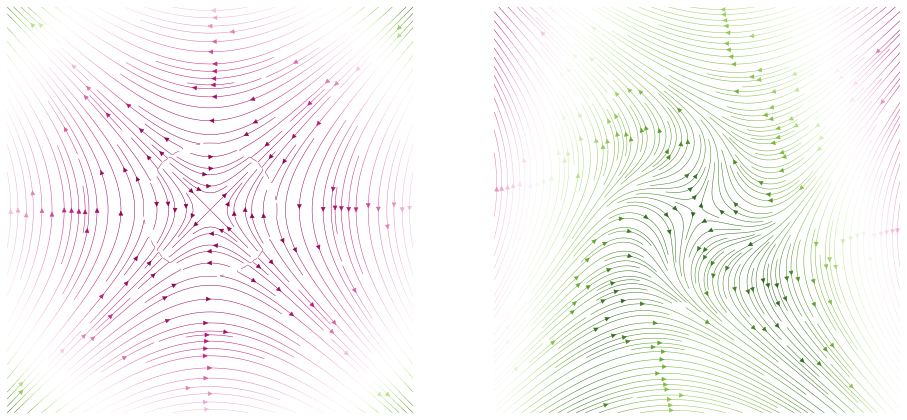
fig, ax = plt.subplots(1,2,figsize = (16,8))
X, Y = np.meshgrid(np.linspace(-3.0, 3.0, 30), np.linspace(-3.0, 3.0, 30))
u, v = np.zeros_like(X), np.zeros_like(X)
NI, NJ = X.shape
for i in range(NI):
for j in range(NJ):
x, y = X[i, j], Y[i, j]
r, theta = (x**2 + y**2)**0.5, np.arctan2(y, x)
u[i,j] = (r - r**3) * np.sin(theta)
v[i,j] = (r - r**3) * np.cos(theta)
ax[0].streamplot(X, Y, u, v, color= np.sqrt(u**2 + v**2),cmap = plt.cm.PiYG, linewidth=0.5, density=2)
ax[0].axis('square')
ax[0].axis([-3, 3, -3, 3]);
ax[0].axis('off')
for i in range(NI):
for j in range(NJ):
x, y = X[i, j], Y[i, j]
r, theta = (x**2 + y**2)**0.5, np.arctan2(y, x)
u[i,j] = (r - r**3) * np.sin(theta) - x
v[i,j] = (r - r**3) * np.cos(theta) + y
norms = np.abs(X**2 + Y);
ax[1].streamplot(X, Y, u, v, color= 1 - norms/np.max(norms),cmap = plt.cm.PiYG, linewidth=0.5, density=3)
ax[1].axis('square')
ax[1].axis([-3, 3, -3, 3]);
ax[1].axis('off');
Das vorliegende Skript begleitet die Vorlesung Mathematik für Physikstudierende C und ist im Wintersemester 21/22 an der FAU Erlangen-Nürnberg entstanden. Es soll den Studierenden zusätzlich zur virtuellen Vorlesung als Nachschlagewerk dienen und ist ausführlicher und genauer gehalten als die Vorlesungsnotizen.
Referenz
Das Skript orientiert sich teilweise an dem Vorlesungsskript “Mathematik für Physikstudierende 3” [Kna20] von Prof.Dr.Andreas Knauf (FAU) aus dem Sommersemester 2020 und den Folien zu „Mathematik für Physiker 3“ von Prof.Dr.Hermann Schulz-Baldes (FAU) [SB18].